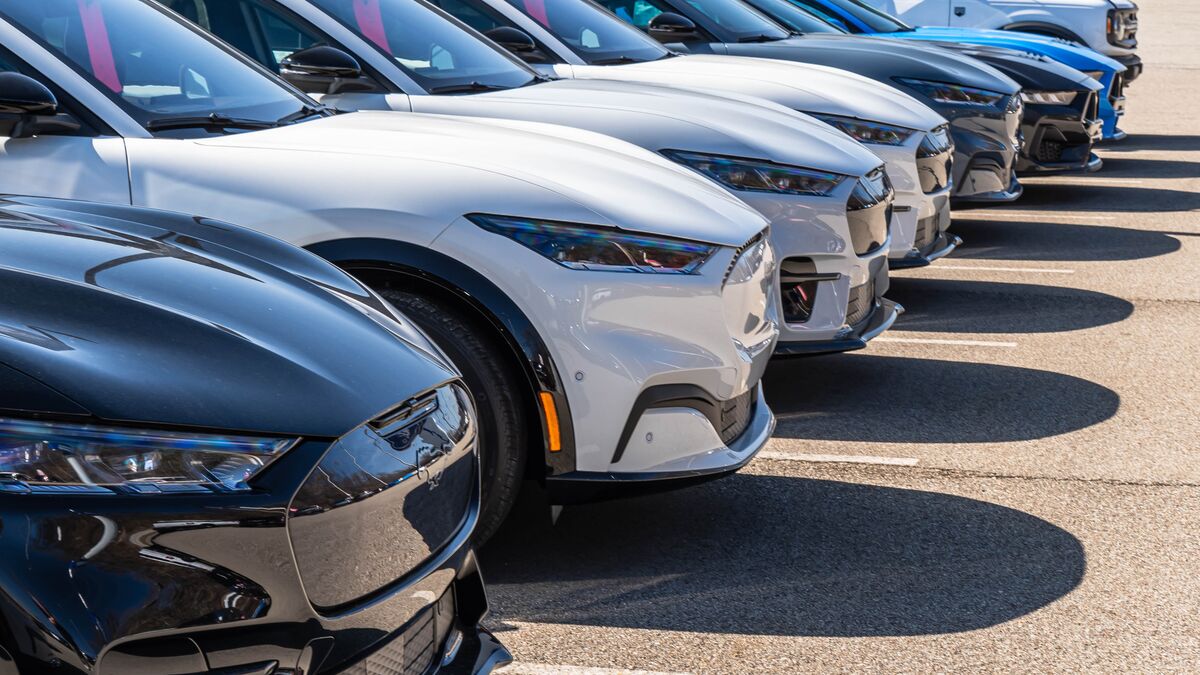
Potentially confusing technology that affects everything from door handles to wireless charging pads is negatively affecting drivers’ reports of problems in new cars, according to a recent study.
In J.D. Power’s 37th annual Initial Quality Study study, cars reached a new record high in problems reported. Researchers surveyed 93,380 purchasers and lessees of 2023-model cars. They asked about problems encountered in the first 90 days of ownership.
The results were shocking. This year’s problems per 100 vehicles (PP100) have risen to an alarming 192. That is a 30 PP100 increase since the last quality study completed in 2022. The higher the number goes, the lower the quality of vehicles is.
With Complex Technology Comes Complex Issues
One of the most prominent reported issues ties back to technology. Features such as touch point door handles, wireless phone charging pads, and safety sensors led to a multitude of problems. The more intricate cars become, the more software issues and difficulties they pose.
A Surprising Shift in the Charts
The rankings saw some major changes.
Last year’s top brand in the Initial Quality Study was Buick. This year the brand dipped to the fourth position. On the other hand, Dodge has moved from second place last year to first.
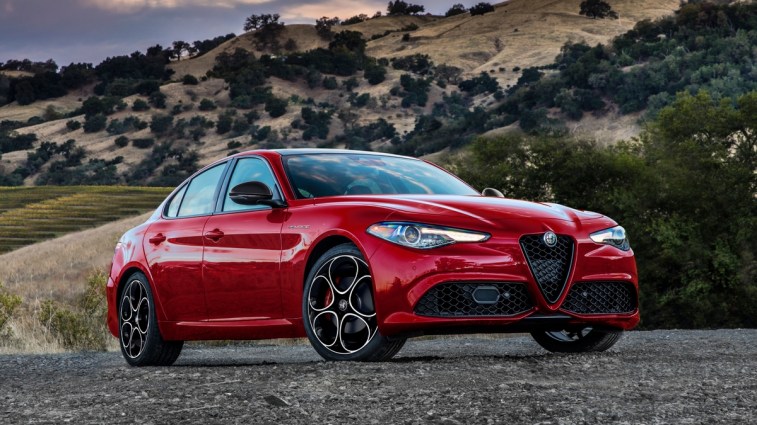
Alfa Romeo takes the prize for making the most stark transition. Where the brand once sat at 27th place with a 211 PP100, it climbed to third place this year with an astounding improvement to 143 PP100.
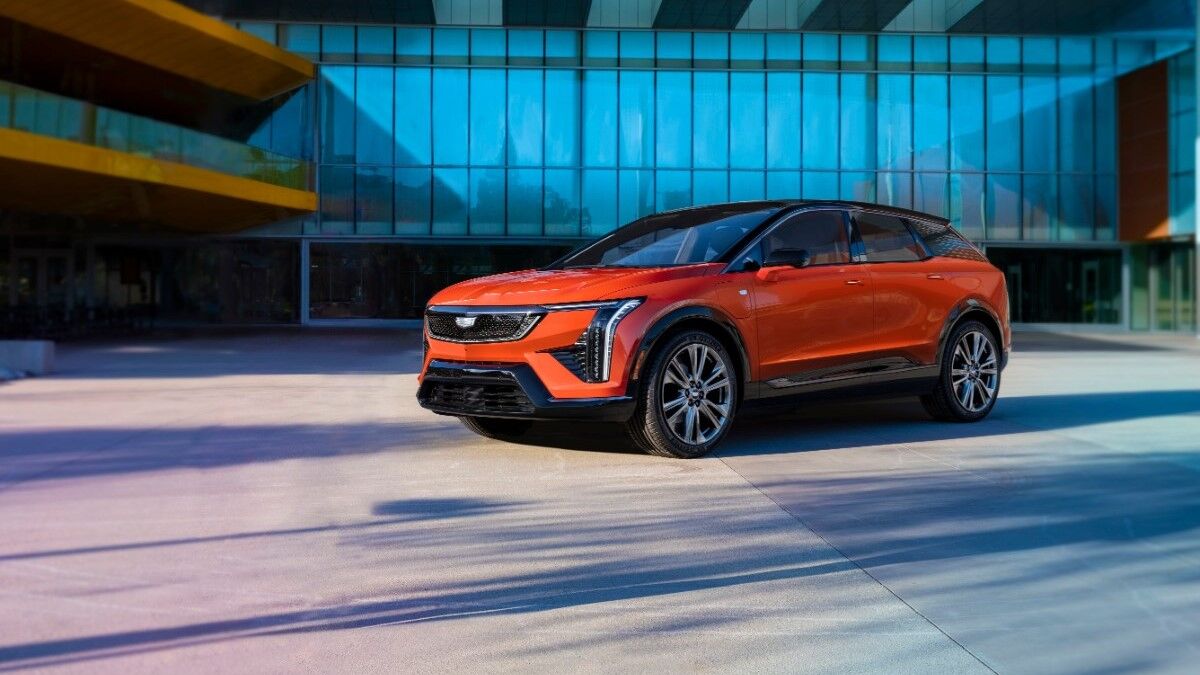
Alfa Romeo (143 PP100) now ranks the highest in terms of luxury vehicles, followed by Porsche (167 PP100) and Cadillac (170 PP100).
With the exception of Dodge and Alfa Romeo, every single brand has significantly dipped in vehicle quality. The rankings have rearranged and many brands have moved up, though their PP100 reading worse than before.
The Rankings:
| Brand | Problems Per 100 Vehicles |
| Dodge | 140 |
| Ram | 141 |
| Alfa Romeo | 143 |
| Buick | 162 |
| Chevrolet | 166 |
| GMC | 167 |
| Porsche | 167 |
| Cadillac | 170 |
| Kia | 170 |
| Lexus | 171 |
| Genesis | 176 |
| Mini | 179 |
| Nissan | 180 |
| Maserati | 182 |
| Jaguar | 185 |
| Subaru | 185 |
| Hyundai | 188 |
| Honda | 190 |
| Jeep | 191 |
| BMW | 192 |
| Industry Average | 192 |
| Mitsubishi | 193 |
| Toyota | 194 |
| Ford | 201 |
| Mercedes-Benz | 201 |
| Land Rover | 203 |
| Mazda | 203 |
| Acura | 207 |
| Lincoln | 208 |
| Infiniti | 212 |
| Audi | 221 |
| Volkswagen | 249 |
| Chrysler | 250 |
| Volvo | 250 |
| *Tesla | 257 |
| *Polestar | 313 |
*Tesla and Polestar are not officially ranked. J.D. Power explains that the companies “do not grant J.D. Power permission to survey its owners in states where authorization is required. Nonetheless, a score was calculated based on a sample of surveys from owners in the other states.”